The End of “Cheap Tokyo”: A Deep Dive into the 5-Year Structural Shift of Japan’s Real Estate Market
Introduction: The Sleeping Giant Has Awoken
For the past decade, global investors have whispered about Tokyo as the world’s last great “undervalued” metropolis. While real estate prices in New York, London, Hong Kong, and Singapore skyrocketed to stratospheric levels, Tokyo remained surprisingly stable. A luxury apartment in Minato-ku could be acquired for a fraction of the cost of a comparable unit in Manhattan or Kensington.
However, new data released by Tokyo Kantei suggests that this era of price stagnation is emphatically over.
We have analyzed the “Required Annual Household Income for New Condominiums” in the Greater Tokyo Area, comparing the landscape of 2019 against 2024.
The results are not merely an update on inflation; they represent a fundamental structural shift in the Japanese property market.
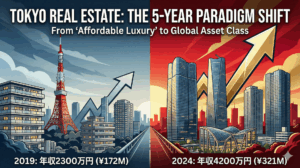
In just five years, the “entry ticket” for Tokyo’s premier districts has effectively doubled. For international investors and expatriates residing in Japan, understanding this shift is no longer optional—it is critical for wealth preservation and strategic acquisition. But beyond the charts and graphs, this shift forces us to ask a deeper question: What is the true purpose of a home in post-pandemic Tokyo?
Part 1: The Data — A Tale of Two Cities (2019 vs 2024)
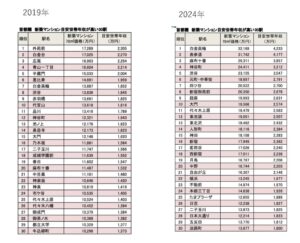
To understand the magnitude of the change, we must look at the hard numbers provided by Tokyo Kantei. Below is the complete translation of the top 30 stations ranked by the estimated household income required to purchase a 70㎡ new condominium.
2019 Ranking: The Pre-Pandemic Baseline
| Rank | Station Name | 70㎡ Price (10k JPY) | Est. Income (10k JPY) |
| 1 | Gaienmae | 17,289 | 2,305 |
| 2 | Shirokanedai | 17,025 | 2,270 |
| 3 | Hiroo | 16,903 | 2,254 |
| 4 | Aoyama-Itchome | 16,604 | 2,214 |
| 5 | Hanzomon | 15,033 | 2,004 |
| 6 | Ebisu | 14,691 | 1,959 |
| 7 | Shirokane-Takanawa | 13,887 | 1,852 |
| 8 | Shibuya | 13,836 | 1,845 |
| 9 | Akabanebashi | 13,691 | 1,825 |
| 10 | Daikanyama | 13,618 | 1,816 |
| 11 | Shinagawa | 13,416 | 1,789 |
| 12 | Kamiyacho | 12,321 | 1,643 |
| 13 | Ikenoue | 12,176 | 1,623 |
| 14 | Sengakuji | 12,173 | 1,623 |
| 15 | Daimon | 12,148 | 1,620 |
| 16 | Nogizaka | 11,881 | 1,584 |
| 17 | Futako-Tamagawa | 11,747 | 1,566 |
| 18 | Seijo-Gakuen-Mae | 11,639 | 1,552 |
| 19 | Kasuga | 11,602 | 1,547 |
| 20 | Azabu-Juban | 11,487 | 1,532 |
| 21 | Nakameguro | 11,101 | 1,480 |
| 22 | Kagurazaka | 10,646 | 1,420 |
| 23 | Shinsen | 10,619 | 1,416 |
| 24 | Ichigaya | 10,535 | 1,405 |
| 25 | Yoyogi-Uehara | 10,524 | 1,403 |
| 26 | Yoyogi-Hachiman | 10,452 | 1,394 |
| 27 | Onarimon | 10,379 | 1,384 |
| 28 | Ochanomizu | 10,368 | 1,382 |
| 29 | Toritsu-Daigaku | 10,329 | 1,377 |
| 30 | Ushigome-Yanagicho | 10,298 | 1,373 |
2024 Ranking: The New Market Reality
| Rank | Station Name | 70㎡ Price (10k JPY) | Est. Income (10k JPY) |
| 1 | Shirokane-Takanawa | 32,169 | 4,233 |
| 2 | Omotesando | 31,742 | 4,177 |
| 3 | Azabu-Juban | 29,311 | 3,857 |
| 4 | Kamiyacho | 24,411 | 3,212 |
| 5 | Shibuya | 23,155 | 3,047 |
| 6 | Motomachi-Chukagai | 18,697 | 2,791 |
| 7 | Yotsuya | 20,522 | 2,700 |
| 8 | Shinjuku-Gyoemmae | 20,350 | 2,678 |
| 9 | Ginza | 19,993 | 2,631 |
| 10 | Daimon | 19,566 | 2,574 |
| 11 | Yoyogi-Uehara | 19,479 | 2,563 |
| 12 | Higashi-Ikebukuro | 19,051 | 2,507 |
| 13 | Higashi-Kitazawa | 18,482 | 2,432 |
| 14 | Ningyocho | 18,116 | 2,384 |
| 15 | Kanda | 18,108 | 2,383 |
| 16 | Shinjuku | 17,949 | 2,362 |
| 17 | Myogadani | 17,026 | 2,240 |
| 18 | Nishi-Shinjuku | 17,011 | 2,238 |
| 19 | Tsukishima | 16,767 | 2,206 |
| 20 | Nakano | 16,744 | 2,203 |
| 21 | Jiyugaoka | 16,307 | 2,146 |
| 22 | Yokohama | 13,245 | 1,977 |
| 23 | Fudomae | 14,974 | 1,970 |
| 24 | Hongo-Sanchome | 14,638 | 1,926 |
| 25 | Tama-Plaza | 12,655 | 1,889 |
| 26 | Hiyoshi | 12,238 | 1,827 |
| 27 | Futako-Tamagawa | 13,873 | 1,825 |
| 28 | Nihon-Odori | 12,214 | 1,823 |
| 29 | Gotanda | 13,770 | 1,812 |
| 30 | Awajicho | 13,677 | 1,800 |
(Source: Tokyo Kantei. Prices and Income are shown in units of 10,000 JPY. E.g., “17,289” = 172.89 Million JPY)
Global Reality Check: 70sqm is a “Studio” in New York It is important to clarify what “70sqm” represents globally.
In Manhattan or London’s prime districts, 70sqm (approx. 750 sq ft) is typically configured as a 1-Bedroom apartment for a single professional.
In Tokyo, developers squeeze 3 Bedrooms into this same footprint to market it as a “Luxury Family Home.” For international investors, the price tag of $2 Million+ is shocking not just because of the amount, but because of what little space you get in return. You are paying Global Luxury prices for Local Economy size.
Key Observations from the Data
1. Price Doubling: The price for the top-ranked area has jumped from ¥172M (Gaienmae) to ¥321M (Shirokane-Takanawa).
2. Income Inflation: The income required to buy the top asset has nearly doubled from ¥23M to ¥42M.
Perhaps the most sobering statistic for prospective buyers is the relative devaluation of purchasing power. If you have a budget or income that would have secured the #1 spot in 2019 (¥23M income), today that places you at rank #15 or #16—somewhere between Kanda and Shinjuku.
Part 2: Analyzing the Top 3 — The New Heavyweights
Why have these specific stations skyrocketed? The 2024 ranking offers clues into where capital is flowing.
1. Shirokane-Takanawa (¥42.33M Income Required)
Previously ranked #7 in 2019, this station has vaulted to #1. This is the “poster child” for the value of large-scale redevelopment. The completion of massive tower projects (such as Shirokane The Sky) has fundamentally repriced the neighborhood. It proves that in Tokyo, redevelopment capability is the single biggest driver of capital appreciation.
2. Omotesando (¥41.77M Income Required)
Consistently one of Tokyo’s most fashionable districts, Omotesando’s rise reflects the scarcity of land. Unlike the bay area where new towers can be built, Omotesando has strict height restrictions and limited plots. The new supply here is ultra-luxury, low-rise boutiques that appeal to the ultra-wealthy who prioritize privacy and brand.
3. Azabu-Juban (¥38.57M Income Required)
Ranking #20 in 2019, Azabu-Juban has seen perhaps the most aggressive repricing, jumping to #3. This is largely due to the “halo effect” of the nearby Azabudai Hills project. The opening of Japan’s tallest skyscraper and the surrounding luxury ecosystem has pulled up values in all adjacent neighborhoods.
Part 3: The Drivers of the Explosion — Why Now?
Foreign investors often ask: “Is this a bubble?”
While prices are high, calling it a bubble ignores the fundamental mechanics of supply and demand. Specifically, there are four critical drivers fueling this shift.
1. The Land War: “Hotels vs. Condos”
The most overlooked factor is the critical shortage of developable land in central Tokyo. There are virtually no empty plots left in the city center; large-scale projects now require complex redevelopment of existing sites.
Crucially, the rapid resurgence of inbound tourism over the last two years has intensified this scarcity. Hotel operators, anticipating high occupancy and room rates, are aggressively bidding for prime land, often outpricing residential developers. When a hotel developer and a condo developer compete for the same plot, the hotel side frequently wins due to higher projected yields.
The result? A sharp decrease in the supply of new condominiums. This scarcity forces buyers into the secondary market, driving resale prices to historical highs.
2. The “Weak Yen” Discount (Foreign Demand)
While a ¥300 million apartment sounds expensive to a local ear earning in JPY, to a US Dollar investor, it is approx. $2 million.
In 2019, when the USD/JPY rate was ~108, a ¥170M apartment cost $1.57 million.
In 2024, with rates fluctuating between 140-150, a ¥300M apartment costs roughly $2.0 – $2.1 million.
Despite a 90% price increase in Yen terms, the price increase in USD terms is significantly milder (approx. 30%).
3. Construction Cost Inflation
Japan is facing a chronic labor shortage in the construction sector. Coupled with the rising cost of imported raw materials (steel, concrete, glass), developers cannot build cheap apartments anymore. The replacement cost of these buildings is providing a solid floor for these valuations.
4. The Shift to “Global Standard” Luxury
Historically, Japanese “luxury” apartments lacked the hotel-like amenities found in NYC or Singapore. The new wave of developments offers true “Global Standard” amenities (valet, doorman, pools), justifying a higher price point.
Part 4: The “Power Couple” Dilemma
This data highlights a sociological shift in Tokyo.
In 2019, a “Power Couple” (e.g., two professionals each earning ¥10M–¥12M) could theoretically stretch to buy the best apartment in the city (Gaienmae).
In 2024, that same couple, with a combined income of ¥24M, finds themselves priced out of the Top 10 entirely. They are now looking at areas like Ningyocho (#14), Kanda (#15), or Shinjuku (#16).
The Top 10 is no longer the playground of high-salary employees; it has become the domain of:
-
Business Owners / Founders
-
Multi-generational Wealth (Asset rich)
-
Foreign Cash Buyers such as Chinese CCP affiliated companies
Part 5: Where is the Financial Opportunity?
If the top of the market has become inaccessible for many, or if you feel the “Top 3” are potentially overheated, where should smart money go?
1. The “Next” Redevelopment Hubs
Look at Nakano (#20, ¥167M) and Ikebukuro areas (Higashi-Ikebukuro #12, ¥190M). These areas are undergoing massive station-front transformations. They are currently priced at nearly half the price of Shirokane, yet their connectivity and livability are rapidly improving.
2. The Resale Market Arbitrage
Since the supply of new condos is strangled by hotel competition and land scarcity, smart investors are looking at high-grade resale properties (built 2010–2019). These can often be acquired at a 20–30% discount compared to new projects.
Part 6: The Pivot — Rethinking “Value” and “Happiness”
While the analysis above focuses heavily on asset value, it is crucial to take a step back and ask a fundamental question: What is a home actually for?
If we view a property not merely as a financial instrument, but as a sanctuary for your family, the necessity of living in Minato-ku or Shibuya-ku diminishes. In fact, stepping out of the “Central Tokyo Condo Race” often yields a far superior Quality of Life (QOL).
1. The “Greater Tokyo” Advantage: Ocean, Greenery, and Space
The overheating is largely concentrated in the central 5 wards. However, Kanagawa, Chiba, and Saitama offer an abundance of “lifestyle-rich” land.
-
Kanagawa (Shonan/Kamakura/Yokohama): For the price of a cramped 2LDK in the city center, you can acquire a spacious home near the ocean.
-
Saitama & Chiba: These areas offer expansive parks and significantly larger floor plans. Choosing these areas is not a “compromise”; it is a strategic decision to prioritize space and mental well-being.
2. The “Detached House” Anomaly in Central Tokyo
For those who must stay in the city, consider: The Compact Detached House.
As condominium prices spiral due to management fees and land competition with hotels, the market for detached homes (Ko-date) is becoming surprisingly attractive.
-
Supply Increase: Recently, we have seen an uptick in the supply of smaller footprint detached homes in central areas.
-
The Logic: You own the land, not just the air rights. There are no monthly management fees. Ironically, a house is becoming a smarter buy than a condo in many central districts.
Conclusion: Stop Guessing. Start Strategizing.
The 2024 Tokyo Kantei data is a clear signal: The rules of engagement have changed.
Buying real estate in Tokyo is no longer just about picking a nice neighborhood. It is a high-stakes financial decision where the entry price is now ¥200M+ ($1.4M USD+) for prime assets, and where hotel developers are eating up the supply of new land.
You have two choices:
-
Chase the market: Continue looking at overheated listings and competing with global cash buyers.
-
Outsmart the market: Identify the undervalued pockets—whether that’s a resale gem in Minato, a detached house in Shibuya, or a luxury retreat in Kanagawa.
Don’t leave your biggest financial decision to chance.
Our team specializes in uncovering off-market opportunities and crafting bespoke portfolios for international clients. We don’t just sell property; we sell clarity in a chaotic market.
The market won’t wait for you. Secure your position today.
Book Your Strategic Consultation Now.
Tokyo kantei data (in Japanese)
Connect with Us for Exclusive Listings & Investment Insights
- LINE – Direct inquiries in Japan
- WhatsApp – For global investors & clients abroad
- Instagram – Market snapshots, listings & updates
- YouTube – In-depth property videos & expert analysis
📱 Scan below to connect instantly.


About the book
Amazon.com Link

#TokyoRealEstate #JapanRealEstate #InvestmentStrategy #MarketTrends #ExpatsInJapan #LuxuryLiving #AssetManagement